Every tool here started as a problem I couldn't find a good solution for — so I built one. They're free, they run right in your browser, and they're proof that educators don't have to wait for the perfect tool to exist. We can make it ourselves.
YouTube shorts
Vibe Coding Projects
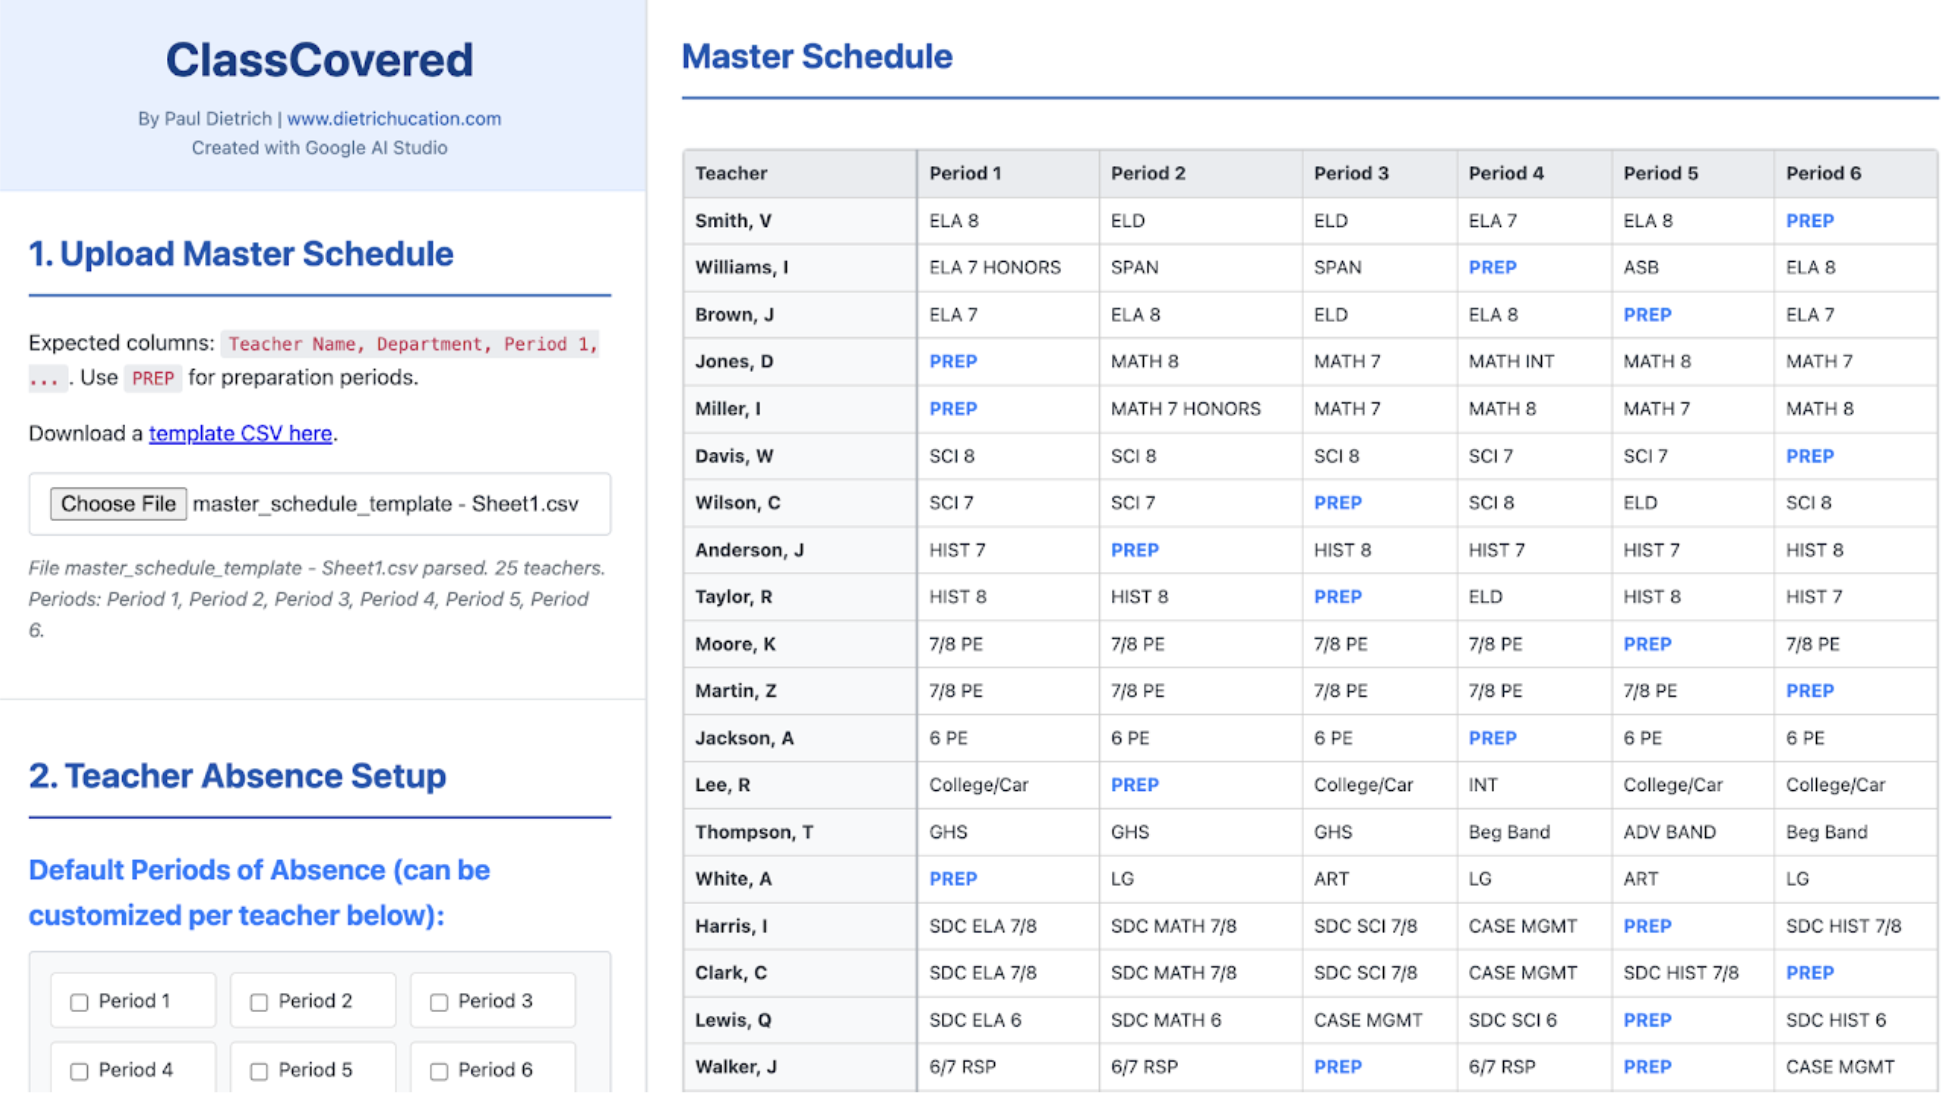
ClassCovered (version 1)
This website allows you to upload your master schedule (based on a template), and then quickly determine substitute teacher coverage (both hired and in-house). This will work great for planning coverage during professional development opportunities and teacher absences. The CSV template is defaulted to a 6-period day, but you can add additional periods simply by adding "Period 7", "Period 8", etc., to the first row of the CSV file.
I vibe coded this website completely through Google AI Studio using Gemini's 2.5 Pro Preview 05-06.
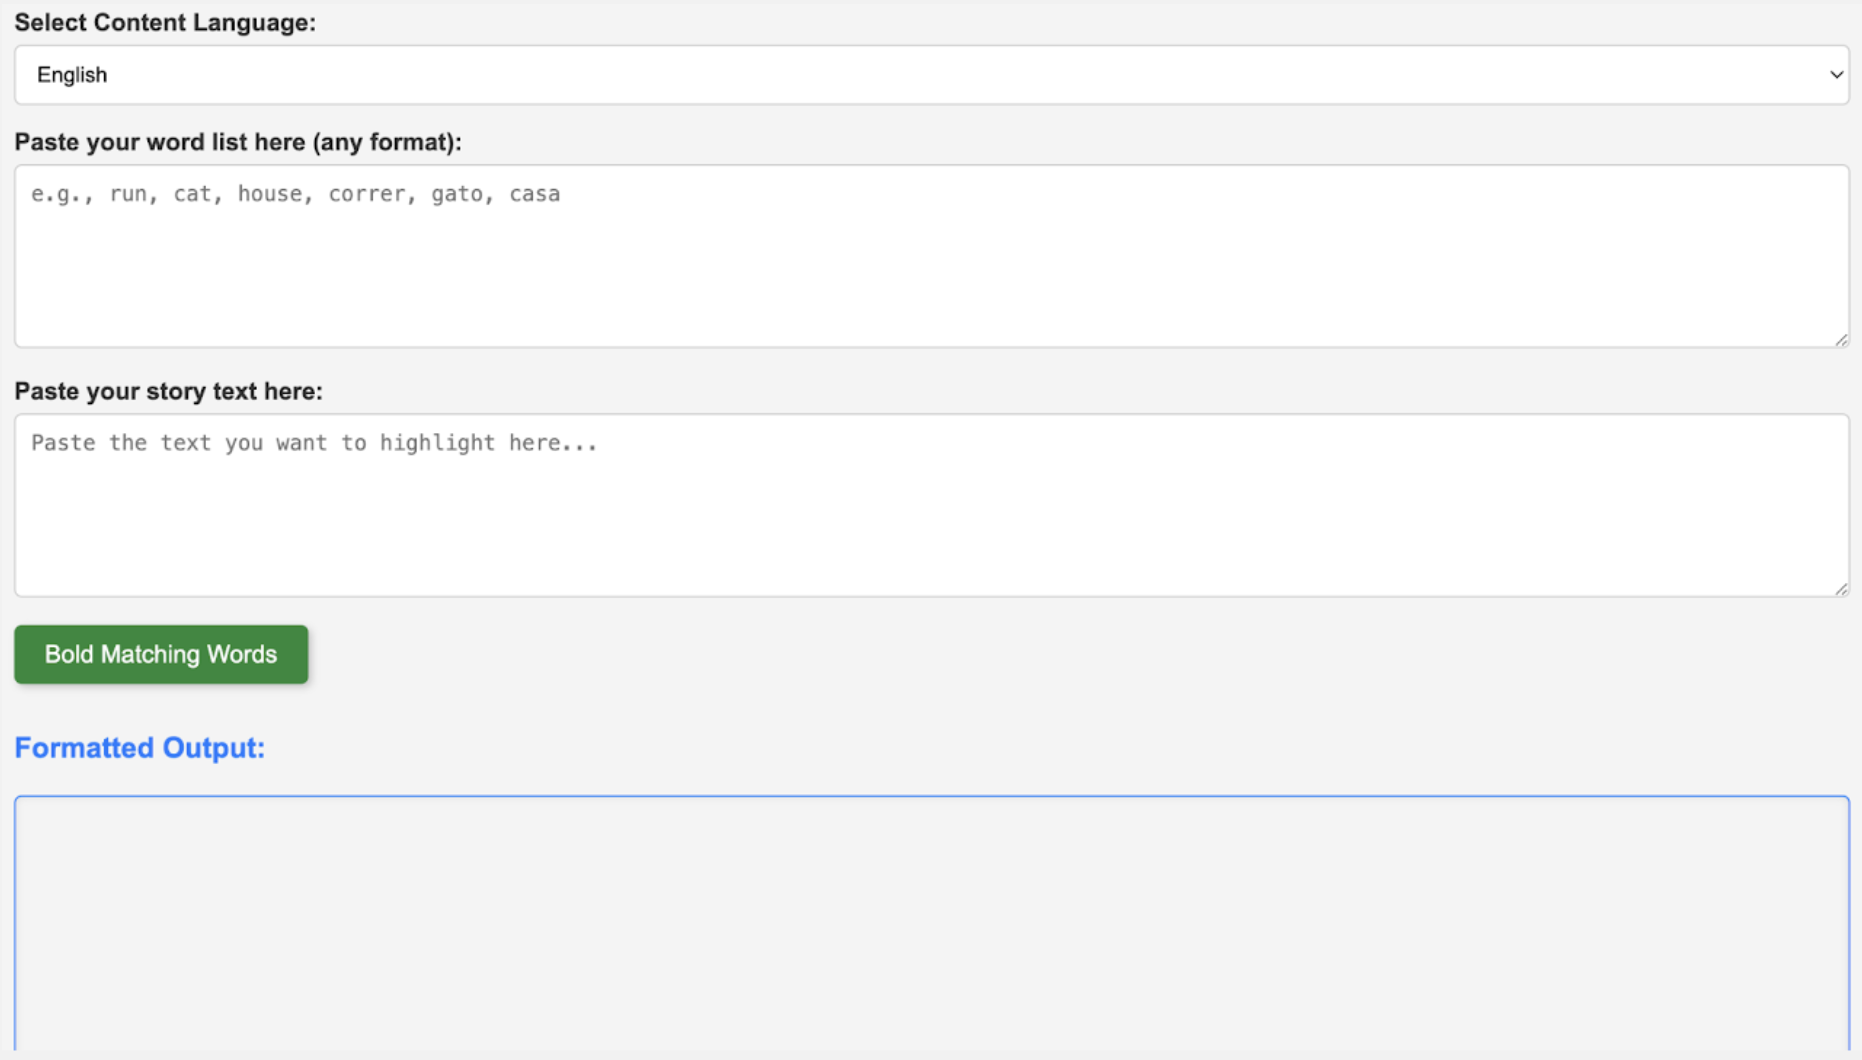
Be bold: the ultimate word highlighter
This website helps you quickly identify and highlight specific words, including their common derivatives and plurals, within any text you provide. It works for both English and Spanish.
I originally began this project because of an elementary teacher's request to have specific high-frequency words highlighted in a story/passage for their students.
I first began vibe coding this website on ChatGPT before I transitioned over to Google Gemini. I finished the website completely using Gemini.
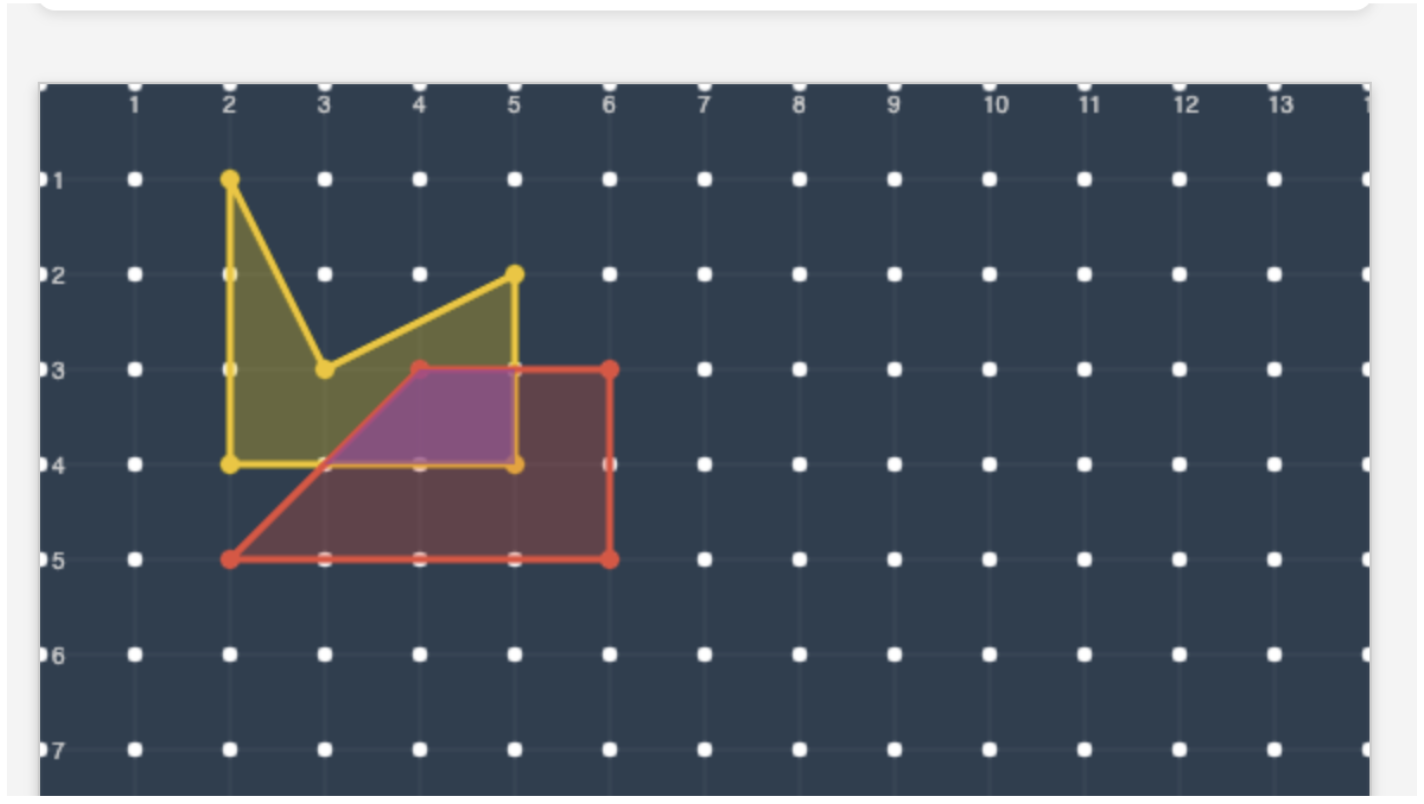
interactive geoboard
This website was inspired by a math question that I encountered during a training. The problem referenced the following geoboard website: apps.mathlearningcenter.org/geoboard/
One of the things that I thought about while playing around with the geoboard website listed above was: "Wouldn't it be awesome if students could see the perimeter, area, and overlapping areas of shapes change in real-time?" I couldn't find this feature on the website, so I decided to use ChatGPT to help me build one. While not perfect, this version of Responsive Geoboard comes fairly close to what I had envisioned.